Austin Plumbing Problem Index 2026
A sourced look at why Austin homes generate so many plumbing calls: Blackland Prairie “Houston Black” clay that shrinks and swells under Central Texas slabs, moderately hard tap water that shortens fixture and water-heater life, and freeze-driven repair spikes like the 31% jump in water-heater permits after Winter Storm Uri. Every figure below comes from the City of Austin’s own open-data portal, Austin Water’s published reports, or USDA/Texas A&M soil-survey data — linked at the point of use so it can be independently checked.
How Big Is Austin’s Plumbing Problem, Really?
Austin doesn’t have one plumbing problem — it has three, stacked on top of each other. The city sits at the western edge of the Blackland Prairie, where expansive clay soil moves under slab foundations every wet-dry cycle. Its municipal water is moderately hard, which shortens the working life of water heaters and fixtures. And its subtropical climate means the occasional hard freeze catches a warm-climate housing stock — and warm-climate plumbing codes — off guard. None of this is guesswork: the City of Austin’s own permit records, Austin Water’s published quality reports, and federal soil-survey data all point the same direction. This index pulls those three threads together in one place, with the source for every number linked directly below it.
When Do Plumbing Repairs Actually Spike in Austin?
The City of Austin’s Issued Construction Permits dataset logs every plumbing repair permit filed since the 1970s. Summing six recent years (2019–2024) by calendar month shows a clear pattern — and it isn’t the one most homeowners expect.
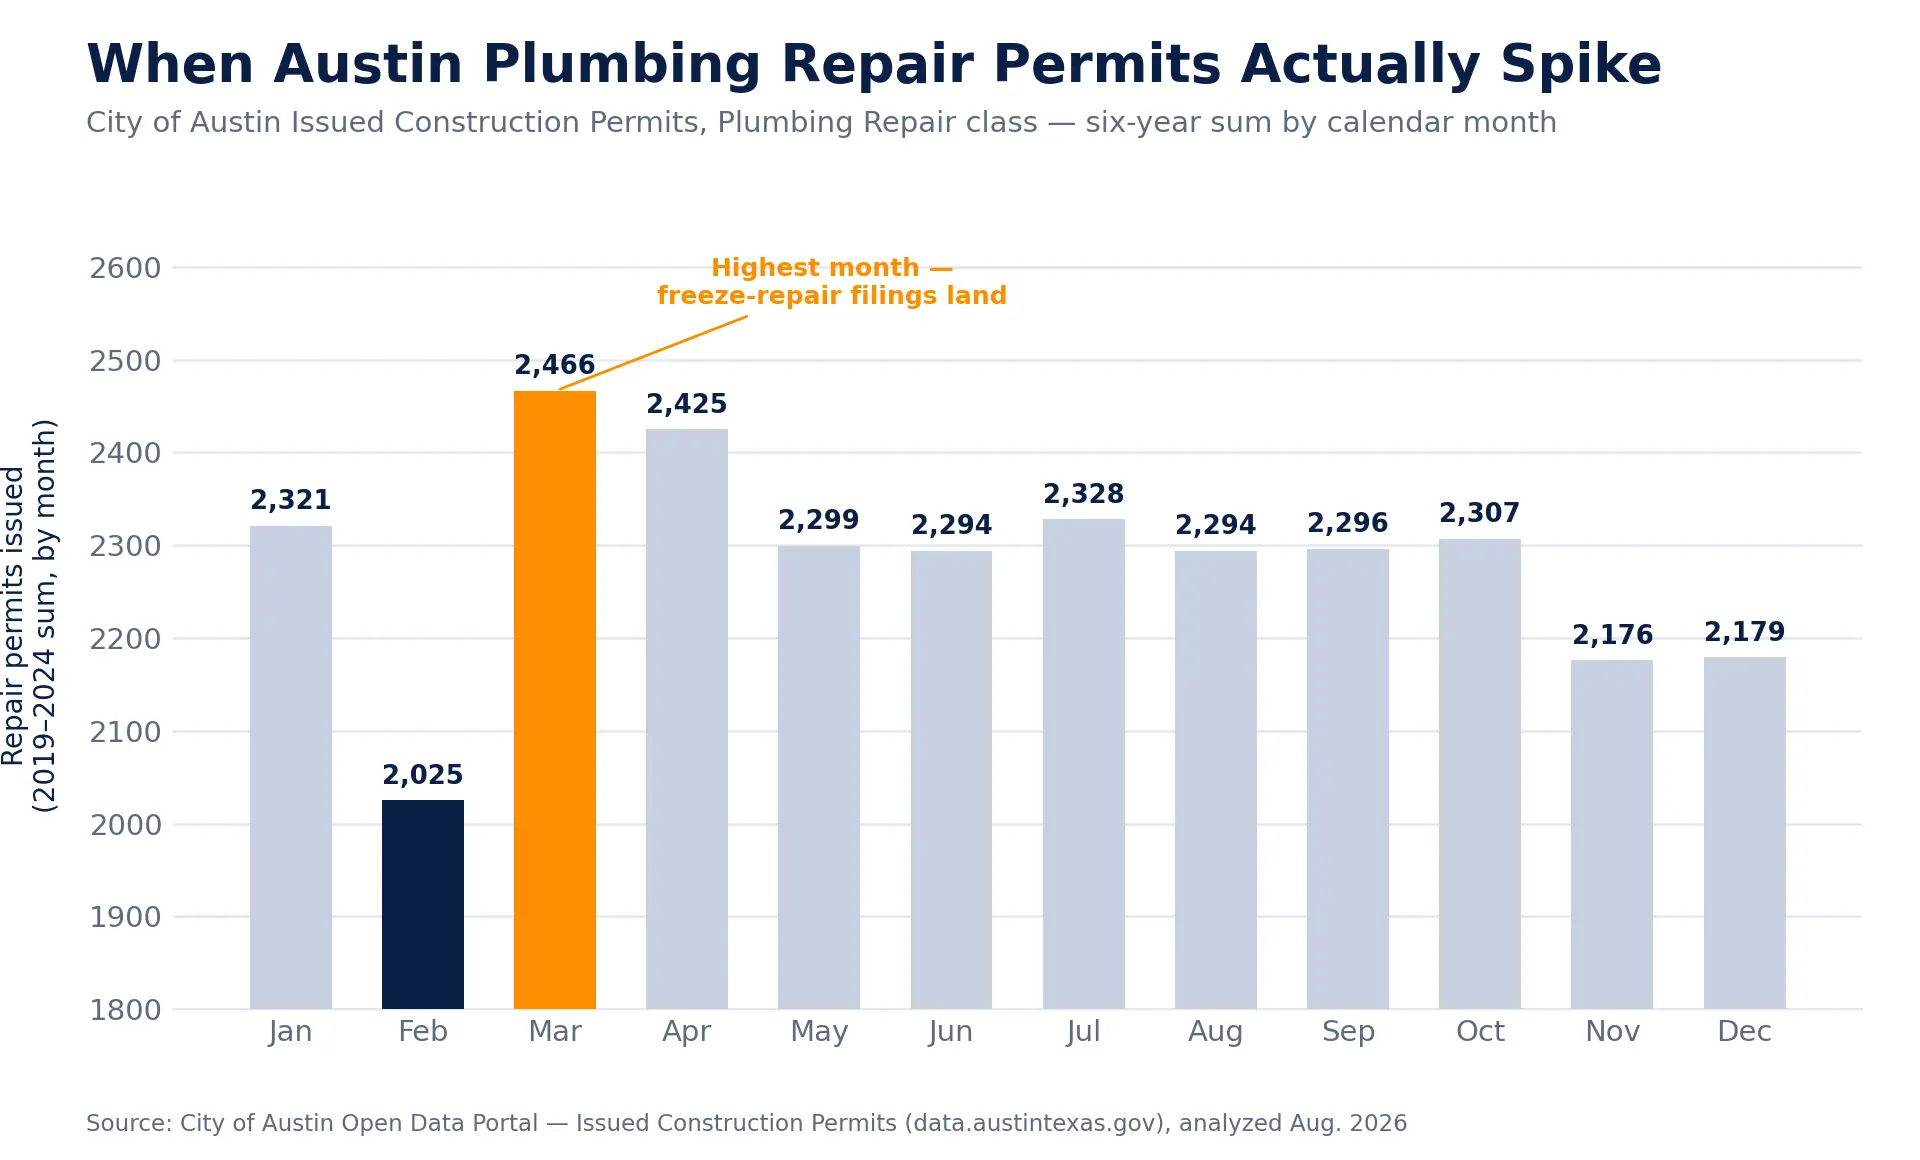
Repair-permit filings don’t spike during the freeze itself — they dip in February, then jump 22% to their annual high in March. That lag matches how freeze damage actually plays out: a pipe cracks during a hard freeze, but the leak, the insurance claim, and the permitted repair often land weeks later, once the ice is gone and contractors can get on the schedule. April holds a similar elevated level before repair volume settles into a flat band (roughly 2,290–2,330 permits per month) for the rest of the year.
Source: City of Austin Open Data Portal – Issued Construction Permits dataset, queried via the public Socrata API, August 2026.
Winter Storm Uri’s Fingerprint Is Still in the Permit Data
Austin Water’s own after-action numbers from February 2021 are well documented: crews completed 381 water-line repairs and 1,200 work orders in ten days, performed more than 1,500 emergency shut-offs, and fielded over 10,000 calls a day at the peak (see our companion Austin Freeze Events & Burst-Pipe Data Reference for the full breakdown). What hasn’t been published before is what that event did to permitted water-heater work at the household level.
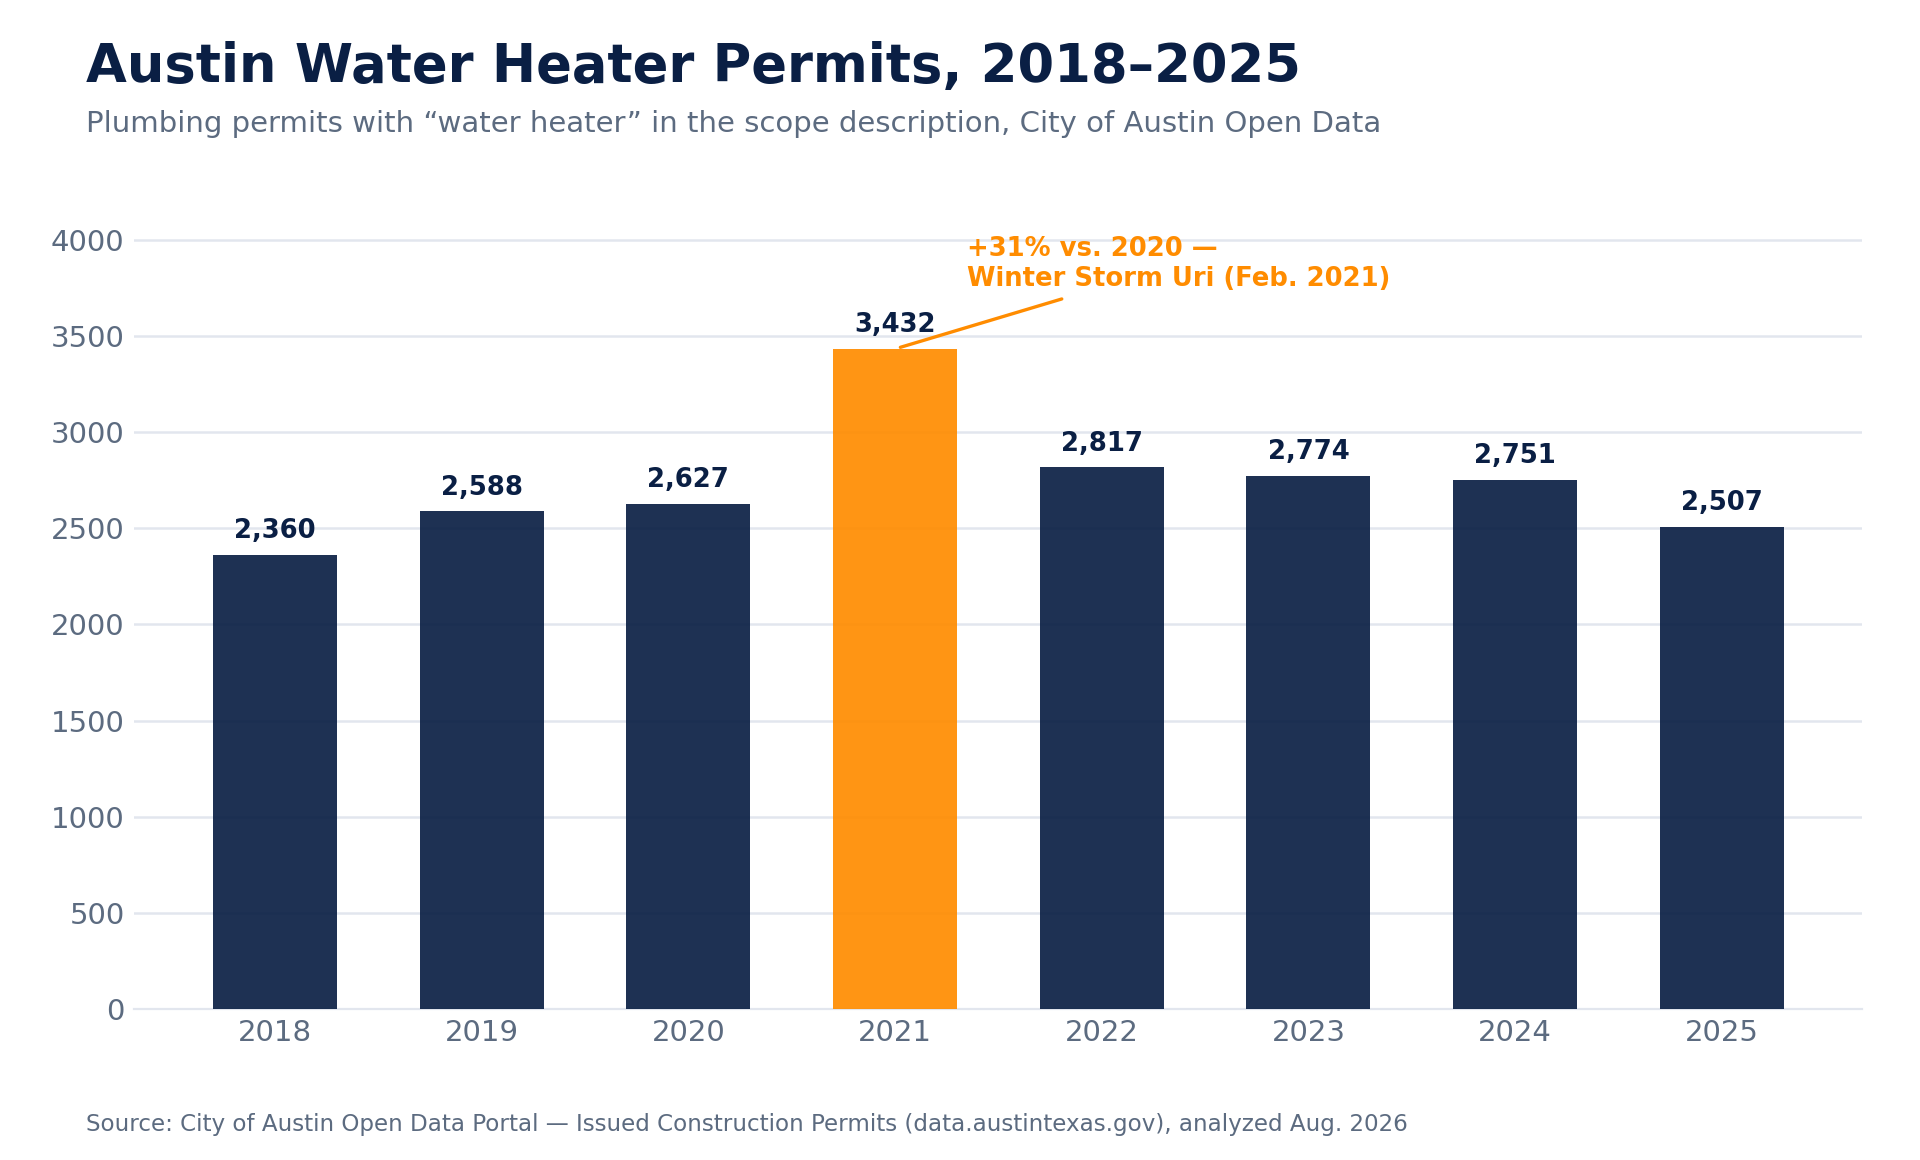
Water-heater permits ran a steady 2,360–2,627 per year from 2018–2020, then jumped to 3,432 in 2021 — a 31% increase — before settling back into the high-2,000s the following years. Tanks that froze, cracked, or were drained and never properly restarted during Uri appear to have driven a wave of replacements that shows up cleanly in the permit record, a full year of lagging demand the freeze itself doesn’t capture.
Source: City of Austin Open Data Portal – Issued Construction Permits dataset, analyzed August 2026.
The Clay Under Austin: Why Slab Leaks Cluster Where They Do
Roughly the eastern half of Austin sits on the Blackland Prairie, a band of expansive clay soil that runs from the Red River through Dallas, Waco, and Austin toward San Antonio. The dominant soil there — Houston Black, officially designated the Texas state soil — is 60–80% clay and classified by soil scientists as a Vertisol: a soil that shrinks and cracks in dry weather and swells dramatically when wet, moving the ground underneath a home’s slab (and the plumbing embedded in it) with every wet-dry cycle. That movement is the mechanical driver behind Central Texas’ well-documented slab-leak pattern.
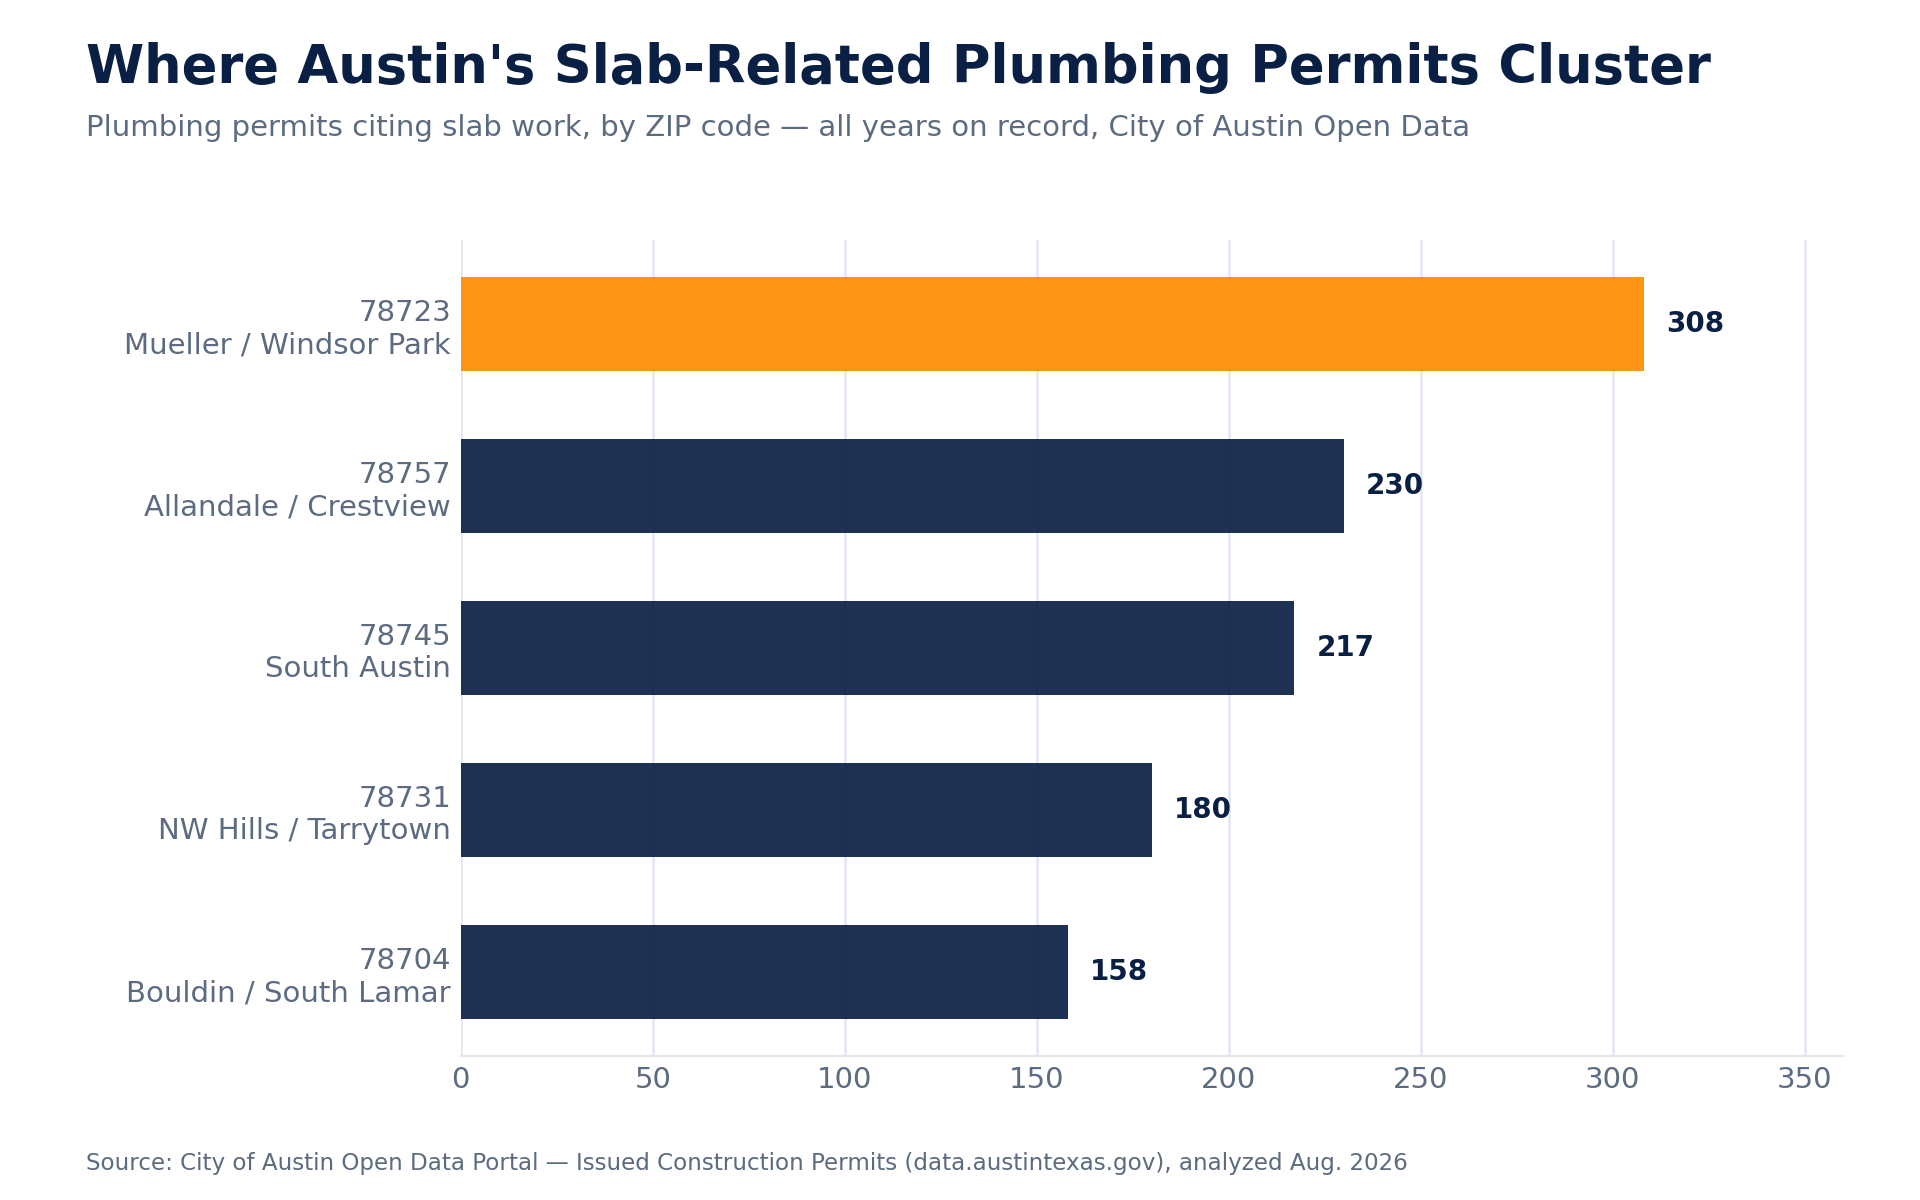
| ZIP code | Area | Slab-related plumbing permits (all-time) |
|---|---|---|
| 78723 | Mueller / Windsor Park | 308 |
| 78757 | Allandale / Crestview | 230 |
| 78745 | South Austin | 217 |
| 78731 | NW Hills / Tarrytown | 180 |
| 78704 | Bouldin / South Lamar | 158 |
78704 and 78745 also lead the city in total plumbing repair permits of every kind (4,433 and 4,250 respectively, all years on record) — but for slab-specific work, 78723’s older Mueller/Windsor Park housing stock, built directly on Blackland clay, pulls ahead of both. Homeowners in any of these five ZIPs are sitting on some of the most reactive soil in the Austin metro.
Sources: City of Austin Open Data Portal, analyzed August 2026; USDA NRCS – Official Series Description, Houston Black Series; Texas A&M AgriLife Extension – Travis County Soils.
Austin’s Hard Water, By the Numbers
Austin Water draws surface water from the Colorado River through Lake Travis and Lake Austin, treating it at three plants before it reaches the tap. The utility’s own 2025 Consumer Confidence Report puts total hardness at 70–126 ppm (as CaCO₃), averaging 93 ppm — roughly 4.1 to 7.4 grains per gallon, averaging 5.4 gpg. That lands Austin in the “moderately hard” to “hard” range on standard water-hardness scales, meaning scale buildup inside tank water heaters, on fixtures, and in appliances is a normal long-term maintenance factor for most Austin homes, not a defect specific to any one property.
Infrastructure context: Austin Water’s Infrastructure Leak Index (ILI) — the industry-standard measure of how much treated water a utility loses to leaks relative to its system size — improved to 5.16 in 2025 from 5.44 in 2024. The utility replaced more than 700 leak-prone water lines over the last two years and canvassed over 750 miles of distribution mains for hidden leaks in 2025 alone, part of an $18 million, five-year line-replacement investment under its Renewing Austin program.
Source: Austin Water – 2025 Water Quality Report (Consumer Confidence Report).
What This Means for Your Home
- If you’re in 78723, 78757, 78745, 78731, or 78704: you’re in one of the five Austin ZIP codes with the most slab-related plumbing permit activity on record. Unexplained warm spots on the floor, a running water meter with every fixture off, or a climbing water bill are worth investigating — see our free water-meter leak test tool or read what a slab leak diagnosis and repair actually involves.
- If your water heater is 8–12 years old: Austin’s hardness range (70–126 ppm) is enough to shorten tank life through scale buildup, especially without periodic flushing. See how sizing and hardness affect a water heater replacement, or look at whether a water softener makes sense for your fixtures and appliances.
- If you have older galvanized or original copper supply lines: repeated slab movement plus decades of hard-water scale is the classic setup for a whole-home repipe conversation rather than one-off spot repairs.
- If you went through Winter Storm Uri (or the January 2026 ice event) and haven’t had your water heater or supply lines inspected since: the permit data suggests you’re not alone — see the full seasonal breakdown in our Austin Winter Pipe-Burst & Freeze Risk Report.
Frequently Asked Questions
What is the Austin Plumbing Problem Index?
It’s a sourced data report compiling public records on why Austin homes generate frequent plumbing repairs — City of Austin permit data, Austin Water’s published quality and infrastructure reports, and USDA/Texas A&M soil-survey data on the region’s expansive clay. Every statistic links to its original public source.
What causes so many slab leaks in Austin?
Much of Austin sits on Blackland Prairie “Houston Black” clay, which is 60–80% clay and shrinks and swells significantly between dry and wet conditions. That movement stresses plumbing lines embedded in or under a home’s slab foundation, which is the primary mechanical driver of Central Texas’ slab-leak pattern.
Is Austin’s water hard on pipes and water heaters?
Austin Water’s 2025 Consumer Confidence Report measured total hardness at 70–126 ppm (average 93 ppm), or roughly 4.1–7.4 grains per gallon (average 5.4 gpg) — moderately hard to hard water that contributes to scale buildup in water heaters and fixtures over time.
Which Austin neighborhoods see the most plumbing repair permits?
By total plumbing repair permits (all types, all years on record), ZIP codes 78704 (Bouldin/South Lamar), 78745 (South Austin), 78757 (Allandale/Crestview), 78723 (Mueller/Windsor Park), and 78731 (NW Hills/Tarrytown) lead the city. For slab-specific permits alone, 78723 leads all Austin ZIP codes.
Does Winter Storm Uri still affect Austin plumbing demand today?
Its direct impact was concentrated in 2021 — water-heater permits jumped 31% that year before settling back into the high-2,000s in later years — but Central Texas has seen a hard-freeze event in most winters since (Winter Storm Mara in 2023, a significant ice event in January 2026), so freeze-related plumbing demand remains a recurring seasonal pattern rather than a one-time event.
Is this real data, or an estimate?
Every figure in this index is either a direct count from the City of Austin’s public permit dataset (queried via its Socrata API in August 2026) or a published figure from Austin Water’s own Consumer Confidence Report and after-action reporting, or from USDA/Texas A&M soil-survey sources. Nothing here is modeled or estimated; the methodology section below documents exactly how each number was pulled.
Methodology
Permit figures were queried directly from the City of Austin’s public Socrata API (data.austintexas.gov, Issued Construction Permits dataset) in August 2026, filtered to permit_type_desc = “Plumbing Permit,” and further filtered where noted to the Repair or Change Out work classes, or to permit descriptions containing specific terms (e.g., “water heater,” “slab”). Because permits are issued when work is scheduled or completed — not necessarily the moment damage occurs — permit timing reflects filing and scheduling patterns, not real-time failure rates. Figures are counts of permits, not counts of unique properties, addresses, or households; a single property can generate more than one permit. Water quality and infrastructure figures are drawn directly from Austin Water’s published 2025 Consumer Confidence Report. Soil characteristics are drawn from USDA NRCS and Texas A&M AgriLife Extension public soil-survey resources for Travis County. This is a data reference, not plumbing, engineering, or soil-science advice specific to any property. Compiled and published August 2026; every source is linked directly below so figures can be independently verified.
Sources & Further Reading
- City of Austin Open Data Portal – Issued Construction Permits dataset
- Austin Water – 2025 Water Quality Report / Consumer Confidence Report
- Austin Water – 2025 Water Quality Report (PDF)
- City of Austin – Winter Storm Uri After-Action Report & Resources
- USDA NRCS – Official Series Description, Houston Black Soil Series
- Texas A&M AgriLife Extension – Travis County Soils & Web Soil Survey Guide
- Community Impact – Austin Water on Winter Storm Uri recovery (300+ line breaks in two weeks)
Cite This Report
Free to cite, link to, or embed — attribution appreciated. Copy-paste citation:
Embeddable stat card (copy the HTML below and paste into any page or CMS):
Related Austin Resources
About this index
This index compiles publicly available data from the City of Austin Open Data Portal, Austin Water’s published Consumer Confidence and after-action reports, and USDA/Texas A&M AgriLife soil-survey resources. It is a data reference, not plumbing, engineering, or soil-science advice specific to any property. Compiled and published August 2026; source pages are linked directly above so figures can be independently verified. We plan to refresh this index as new permit-year and water-quality data is published.
Disclosure: ATX Plumbing Pros (atxplumbingpros.com) is a free referral and dispatch service. We are not a licensed plumbing company and do not directly provide plumbing services. All work is performed by independent, licensed and insured third-party Texas Master Plumbers in your area. Submitting your ZIP connects you with a participating provider, who may contact you regarding your request. Same-day, emergency, and 24/7 availability are not guaranteed and depend on provider schedules, location, and demand. Service availability, pricing, licensing, and final response times are determined solely by the providers. In a life-threatening emergency, call 911.